
59doit
[ R ] 교차분석과 카이제곱 연습문제 ch12 본문
1. 직업 유형에 따른 응답 정도에 차이가 있는가를 단계별로 검정하시오 (동질성 검정)
#1) 파일 가져오기Response.csv
#2) 코딩변경 - 리코딩
#Job 컬럼: 1. 학생, 2. 직장인, 3. 주부
#response 컬럼: 1. 무응답, 2. 낮음. 3. 높음
#3) 교차 분할표 작성
#4) 동질성 검정
#5) 검정결과 해석
(1) 파일 가져오기Response.csv
| setwd("C:/") data <- read.csv("Response.csv") data |
(2) 코딩변경 - 리코딩
| data$job2[data$job == 1] <- "학생" data$job2[data$job == 2] <- "직장인" data$job2[data$job == 3] <- "주부" data$response2[data$response == 1] <- "무응답" data$response2[data$response == 2] <- "낮음" data$response2[data$response == 3] <- "높음" head(data) # job response job2 response2 # 1 1 1 학생 무응답 # 2 1 1 학생 무응답 # 3 1 1 학생 무응답 # 4 1 1 학생 무응답 # 5 1 1 학생 무응답 # 6 1 1 학생 무응답 |
(3) 교차 분할표 작성
| table(data$job2, data$response2) # 낮음 높음 무응답 # 주부 41 59 5 # 직장인 62 53 10 # 학생 37 8 25 |
(4) 동질성 검정
| chisq.test(data$job2, data$response2) # Pearson's Chi-squared test # # data: data$job2 and data$response2 # X-squared = 58.208, df = 4, p-value = 6.901e-12 |
(5) 검정결과 해석
#귀무가설: 직업 유형에 따라 응답정도에 차이가 없다.
#대립가설: 직업 유형에 따라 응답정도에 차이가 있다.
#X-squared = 58.208, df = 4, p-value = 6.901e-12
# p-value < 0.05 로 귀무가설을 기각.
# 결론 : 직업 유형에 따른 응답 정도에 차이가 있다, 세 집단 간의 응답율이 서로 다르다고 할 수 있다.
2. 나이(age)와 직위(position)간의 관련성을 단계별로 분석하시오 (독립성 검정)
#1) 파일 가져오기 cleanData.csv
#2) 코딩 변경(변수 리코딩)
#3) 산점도를 이용한 변수간의 관련성 보기 (힌트. Plot(x,y)함수 이용)
#4) 독립성 검정
#5) 검정결과 해석
(1) 파일 가져오기Response.csv
| data <- read.csv("C:/cleanData.csv", header = TRUE) head(data) |
(2) 코딩변경 - 리코딩
| X <- data$position #행: 직위 변수 이용 Y <- data$age3 #열: 나이 리코딩 변수 이용 |
(3) 산점도를 이용한 변수간의 관련성 보기 (힌트. Plot(x,y)함수 이용)
plot(data$position,data$age3)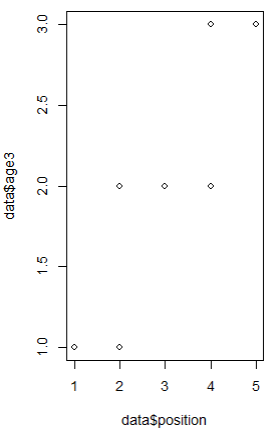 |
X <- df$position Y <- df$age3 Y plot(X,Y,abline(lm(Y~X))) 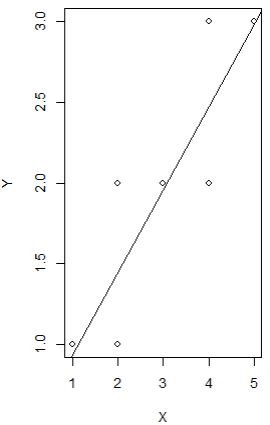 |
- 오른쪽 결과에 따라 직위가 높을 수록(5:낮음 1:높음) 나이가 많음 (음의 상관관계)
(4) 독립성 검정
| library(gmodels) CrossTable(x=data$position , y=data$age3, chisq = TRUE) 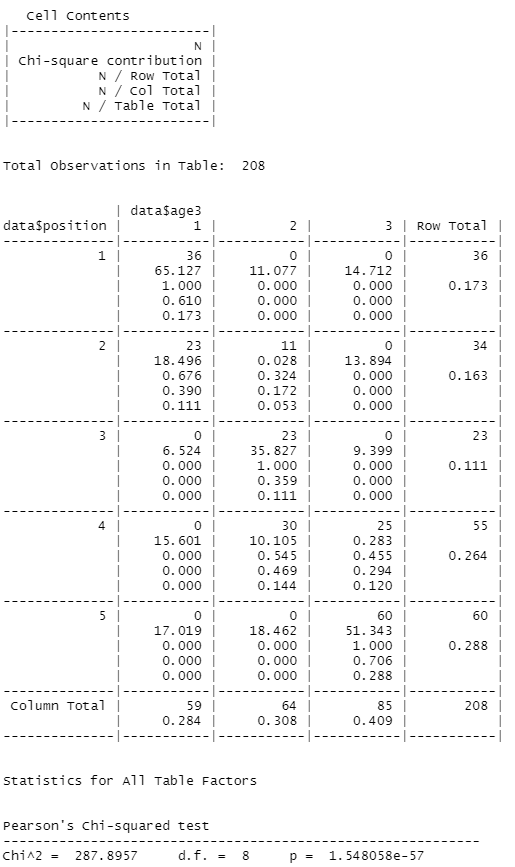 |
(5) 검정 결과 해석
#귀무가설: 나이(age)와 직위(position)는 관련성이 없다
#대립가설: 나이(age)와 직위(position)는 관련성이 있다.
# Chi^2 = 287.8957 d.f. = 8 p = 1.548058e-57
# p-value < 0.05 로 귀무가설을 기각.
# 나이(age)와 직위(position)는 관련성이 있다.
3. 교육수준(education)과 흡연율(smoking)간의 관련성을 분석하기 위한 연구가설을 수립하고, 단계별로 가설을 검정하시오. (독립성 검정)
귀무가설(H0): 교육수준과 흡연율 간의 관련성은 없다
연구가설(H1): 교육수준과 흡연율 간의 관련성은 있다
#1) 파일 가져오기 smoke.csv
#2) 코딩 변경(변수 리코딩)
#education 컬럼(독립변수) : 1. 대졸, 2. 고졸, 3. 중졸
#smoke 컬럼(종속변수): 1. 과다흡연, 2. 보통흡연, 3. 비흡연
#3) 교차분할표 작성
#4) 독립성 검정
#5) 검정 결과 해석
(1) 파일 가져오기 smoke.csv
| data <- read.csv("C:/smoke.csv", header = TRUE) head(data) # education smoking # 1 1 1 # 2 1 1 # 3 1 1 # 4 1 1 # 5 1 1 # 6 1 1 |
(2) 코딩변경 - 리코딩
| data$education2[data$education == 1] <- "대졸" data$education2[data$education == 2] <- "고졸" data$education2[data$education == 3] <- "중졸" data$smoking2[data$smoking == 1] <- "과다흡연" data$smoking2[data$smoking == 2] <- "보통흡연" data$smoking2[data$smoking == 3] <- "비흡연" head(data) # education smoking education2 smoking2 # 1 1 1 대졸 과다흡연 # 2 1 1 대졸 과다흡연 # 3 1 1 대졸 과다흡연 # 4 1 1 대졸 과다흡연 # 5 1 1 대졸 과다흡연 # 6 1 1 대졸 과다흡연 |
(3) 교차 분할표 작성
| table(data$education2, data$smoking2) # 과다흡연 보통흡연 비흡연 # 고졸 22 21 9 # 대졸 51 92 68 # 중졸 43 28 21 CrossTable(data$education2, data$smoking2, chisq = TRUE) 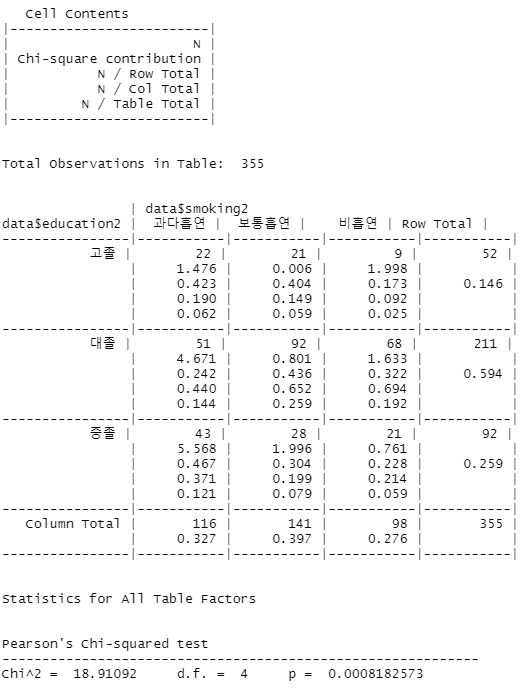 |
(4) 검정 결과 해석
# Chi^2 = 18.91092 d.f. = 4 p = 0.0008182573
# p-value < 0.05 로 귀무가설을 기각.
# 결론 : 교육수준과 흡연율 간의 관련성이 있다.
'Q.' 카테고리의 다른 글
| [ R ] ch14 연습문제 (0) | 2022.11.27 |
|---|---|
| [ R ] 탐색적데이터 예제 평가(6) (0) | 2022.11.25 |
| [ R ] ch 13 연습문제 (0) | 2022.11.23 |
| [ R ] 연습문제 (6) 6-> ch7 (0) | 2022.11.22 |
| [ R ]연습문제 (5) 5->6 (0) | 2022.11.20 |


